Try these awesome Graphs
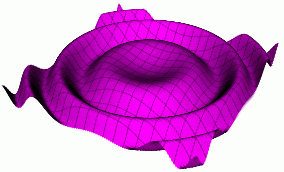
Water Ripple 3D Equation
sin(10(x^2+y^2))/10
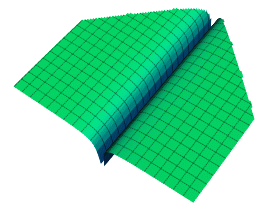
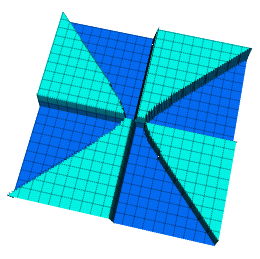
Paper Plane 3D Equation
sign(x) * atan(x*80)/6 * sign(-y-x+1) * sign(-y+x+1)*5 - 1.01
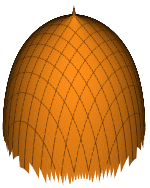
Mosque Dome 3D Function
0.7/log(x^2+y^2)+.6
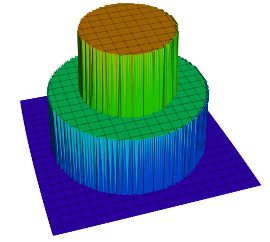
Top Hat 3D Equation
(sign(0.2-(x^2+y^2)) + sign(0.2-(x^2/3+y^2/3)))/3-1
Paper Plane 3D Equation
sign(x) * atan(x*80)/6 * sign(-y-x+1) * sign(-y+x+1)*5 - 1.01
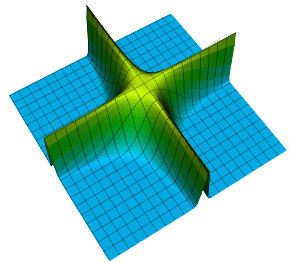
Intersecting Fences
0.75/exp((x*5)^2*(y*5)^2)
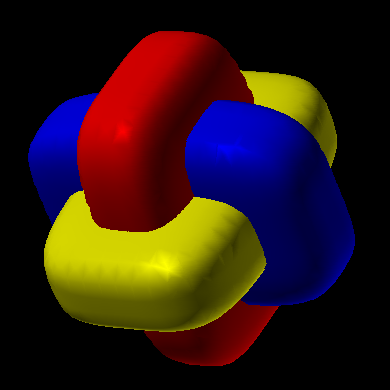
Interlock Equation
(3x/2)^4 + (3x)^4 + z^4 = 1, (3x)^4 + y^4 + (3z/2)^4 = 1, x^4 + (3y/2)^4 + (3z)^4 = 1
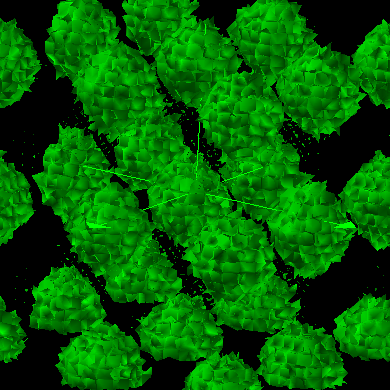
Scatered Equation
Cos(x) + Cos(y) + Cos(z) + Sin(x) + Sin(y) + Sin(z) = 2.2
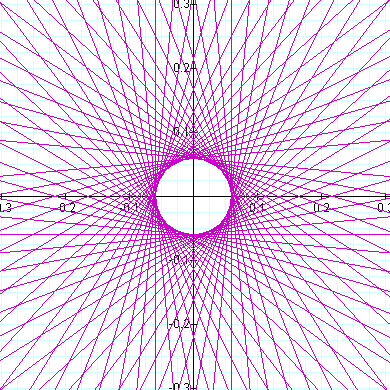
Unamed Equation
r = Tan(17 theta) + Cot(17 theta)